This page will take what we have learnt from building and playing with the neurons in Excel and use this to develop a theoretical understanding of what a neuron does. We'll use Excel again later, but for the most part, you'll need a pen and paper for these exercises.
Aims
- To understand how neural networks can be represented in mathematics.
- To see how using maths can provide us with useful ways of visualising what’s happening.
- To see how formalising a theory can provide us with access to a whole range of knowledge that we may not have had access to otherwise.
setting up
In order to work out the theory of how a neuron uses input parameters (such as albedo and sweetness) to decide into which category the input falls (something worth eating or not), let's compare a neuron that can't perform successful categorisation with one that can.
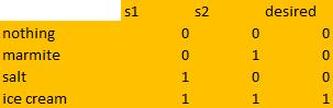
We'll continue using the model we developed first, which decides which foods to eat according to this logic table-->
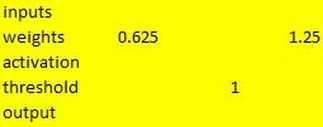
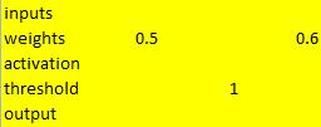
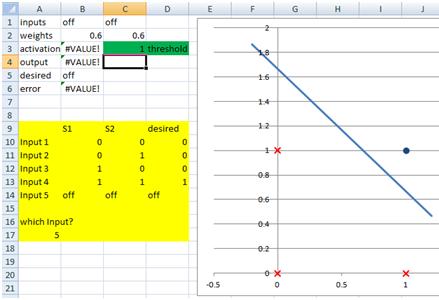
Below I've set down the parameters (weights and thresholds) of the two neurons, and provided a graphical model (a picture!) and the Excel model of each. Just to make it easier to talk about them, I'm going to name neuron 1 Mr Fail and neuron 2 Miss Success.
We'll continue using the model we developed first, which decides which foods to eat according to this logic table-->
Below I've set down the parameters (weights and thresholds) of the two neurons, and provided a graphical model (a picture!) and the Excel model of each. Just to make it easier to talk about them, I'm going to name neuron 1 Mr Fail and neuron 2 Miss Success.
neuron 1 = Mr Failweight 1 = 0.625
weight 2 = 1.25 threshold = 1 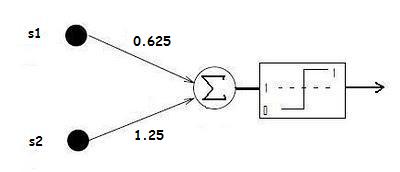
|
neuron 2 = miss successweight 1 = 0.5
weight 2 = 0.6 threshold = 1 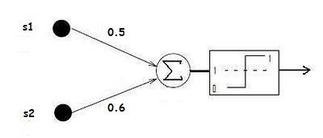
|
a mathematical representation
Now it’s time to write what happens in mathematics. The first thing to do is to formulate what you want to say in words:
· Fire (output 1) IF stimulus one times weight one plus stimulus two times weight two has a value equal to or greater than the threshold.
On a piece of paper, have a try writing it in maths. You can say stimuli one and two = S1 & S2, weights one and two = W1 & W2, and threshold = T. You will also need the greater than or equal to sign, >=
output 1 if _________________________________________________
Answer is at the bottom of the page *
It’s a very simple matter to use this formula to calculate the behaviour of a neuron. Have a check back at the diagrams for Mr Fail and Miss Success above. On a piece of paper, use the formula to calculate the behaviour of both neurons when presented with marmite (S1 = 0, S2 = 1), and when presented with ice cream (S1 = 1, S2 = 1).
Example for Mr Fail is at the bottom of the page **
So, Mr Fail is not behaving correctly, but Miss Success is. This raises the question of exactly how the neural network is able to determine this. If we look at Miss Success, what are the two synapse values of 0.5 and 0.6 and the threshold of 1 doing in order to allow her to correctly determine that she should eat when presented with ice cream, but not in any of the other three situations? This is where computational neuroscience and connectionist networks really have a problem - they are hard to interpret. Is there any way of looking at a bunch or numbers (in this case only three numbers, but, of course, psychologically interesting networks are way more complex than this) and gleaning an understanding of how the network is doing what it is doing (the algorithmic level of Marr's tri-level hypothesis)? The mathematics that we have just seen provides us with a good way to visualise this.
I wonder if this formula looks familiar to you..?
y = mx + c
If you are like me when I first became interested in neural networks, you may have a vague recollection of a high school teacher going on about this. It is actually the equation for a straight line. x is the distance along the horizontal axis and y is the up the vertical axis. m is how steep the line is (its gradient) and c is where the line cuts through the y axis. Here’s an example:
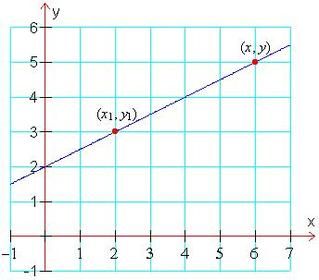
What is the equation for this line?
y increases half as quickly as x,
so the gradient (m) is a half: m = 0.5.
The line cuts through the y-axis at two,
so the y-intercept, c, is 2.
y = 0.5x + 2
Pretty easy, isn’t it!
y increases half as quickly as x,
so the gradient (m) is a half: m = 0.5.
The line cuts through the y-axis at two,
so the y-intercept, c, is 2.
y = 0.5x + 2
Pretty easy, isn’t it!
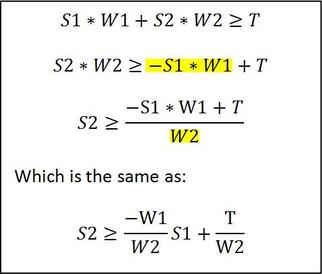
But what we are interested in is neural networks! So why are lines relevant? Well, a really big leap in understanding happened when neural network researchers stepped back and looked at the equation of our artificial neurons and compared it to the equation of a straight line. In order to see the similarity, we need to rearrange our equation a bit. I will do this.
First you must know that the two variables in the straight line equation are our two sensory inputs, S1 and S2 (they are the only two things that vary depending on what food we present to the neuron!).
Try to follow what I’m doing below:
First you must know that the two variables in the straight line equation are our two sensory inputs, S1 and S2 (they are the only two things that vary depending on what food we present to the neuron!).
Try to follow what I’m doing below:
|
This is the equation we worked out earlier for our neuron. I've subtracted the highlited bit from both sides. And now divided both sides by the highlighted bit. Instead of having the whole sum in the numerator being divided by W2, we split it into two separate bits, each divided by W2. We can also move the minus sign and the S1 variable outside the fraction. This is just simple algebra to get the S2 variable in a convenient place. |
Now that's done, compare this equation to the one for a straight line:
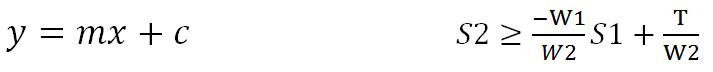
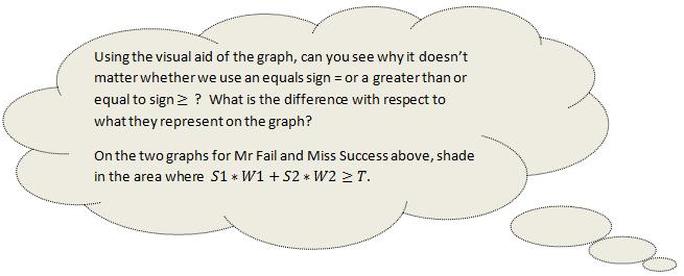
It doesn’t matter whether we use the = sign, which just tells us exactly where the line is, or the sign, which tells us the line and everything on one side of the line (the side where the neuron is firing). So, these are interchangeable in the above equations.
We know that y = S2 and x = S1. Looking at the two equations, what are m and c?
Answer is at the bottom of the page ***
So, the gradient of our line is determined by the two weights, and the place where the line cuts the vertical axis is determined by the threshold value and the second weight. What can we do with this information? Well, we can start by drawing the line and then see if that tells us anything.
Below is a scatter diagram where the two sensory inputs, S1 and S2, are the two axes (because they are the variables).
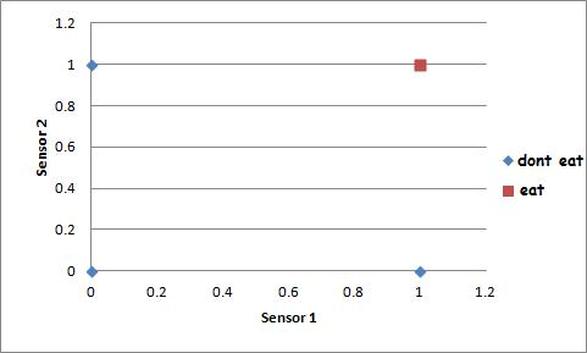
I haven’t put a line on here yet. But what we do have is the different desired outputs. Our neuron only wants to eat ice cream, which stimulates both sensors with a value of one. Find (1,1) on the graph above. There’s a red square – this represents a desired output value of 1 (ice cream, or the fact that our neuron should send a message to the motor system to eat). If you look in the other three positions; (0,0), (1,0) and (0,1), you’ll see blue diamonds – these represent desired output values of 0 (the other foods and the nothing option, or the fact that our neuron should not send a message to the motor system to eat).
This is exactly what an artificial network does! It draws a line which allows it to separate inputs into two categories – those on one side of the line, and those on the other.
An easy way to draw the line is to just choose two different values for x (S1 in the case of our neuron) and use the formula twice to find out the corresponding y (S2) values. We then plot the two positions on the graph, then connect them with a line. I’ll use the values S1 = 0 and S1 = 1.
- If you were to draw one single straight line on this diagram to separate the eat output from the don't eat outputs, where would you draw it?
This is exactly what an artificial network does! It draws a line which allows it to separate inputs into two categories – those on one side of the line, and those on the other.
- Using this new understanding of what a neuron does, we can put the values of the weights and the value of the threshold into the formula we worked out for a line and say, without even having to touch our neuron model, whether it will successfully categorise the inputs just by seeing where the line we draw goes. Let’s do this for the two neurons we described above. I will do Mr Fail, you can do Miss Success.
An easy way to draw the line is to just choose two different values for x (S1 in the case of our neuron) and use the formula twice to find out the corresponding y (S2) values. We then plot the two positions on the graph, then connect them with a line. I’ll use the values S1 = 0 and S1 = 1.
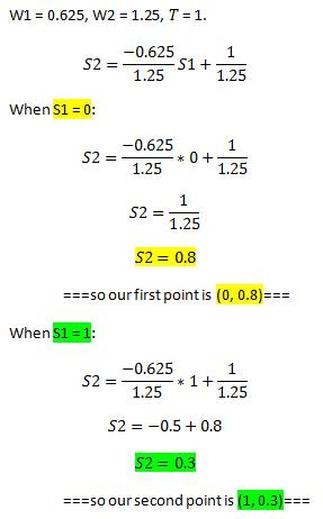
The maths of mr fail
|
Write out the formula, replacing W1, W2 and T with the values of Mr Fail's weights and threshold. Choose an input value for sensor 1. Put the value into the equation and... ... calculate the corresponding value of sensor 2. This gives us a pair of coordinates that we can put on the graph. Choose another value for sensor 1... ... and do the whole lot again... ... to find another corresponding value of sensor 2... ... which gives us another pair of coordinates. |
Now that we have two pairs of coordinates for this neuron, we can put both of them on the graph and connect them to give us a line:
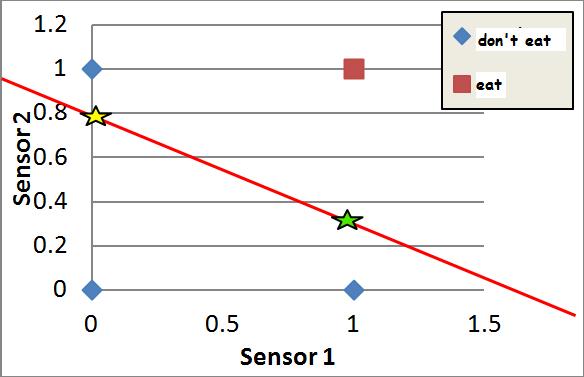
By simply looking at the resulting graph we can see that the red point (the ice cream that we want to eat) is not separated from the blue points (the things that we don't want to eat) by the line. We can also say exactly what the Mr Fail's behaviour will be. He will perform correctly when presented with ice cream (he'll eat it, because it is above the line) and when presented with nothing or with salt (he won't eat them, because they are both below the line), but he will perform incorrectly when presented with marmite, since this is on the same side of the line as the ice cream - the "eat" side of the line.
You may be wondering why I used S1 to find S2 when we have the logic table that tells us values of S1 and S2. Well, remember that Mr Fail's weights are such that his behaviour is incorrect, So what we did with the maths was to choose any value of S1 we liked, then find the value of S2 that would lead to a correct categorisation GIVEN THESE WEIGHTS. In other words, if the coordinates for marmite were (0 , 0.7) instead of (0 , 1), his behaviour would be correct because the marmite point would now be below the line.
You may be wondering why I used S1 to find S2 when we have the logic table that tells us values of S1 and S2. Well, remember that Mr Fail's weights are such that his behaviour is incorrect, So what we did with the maths was to choose any value of S1 we liked, then find the value of S2 that would lead to a correct categorisation GIVEN THESE WEIGHTS. In other words, if the coordinates for marmite were (0 , 0.7) instead of (0 , 1), his behaviour would be correct because the marmite point would now be below the line.
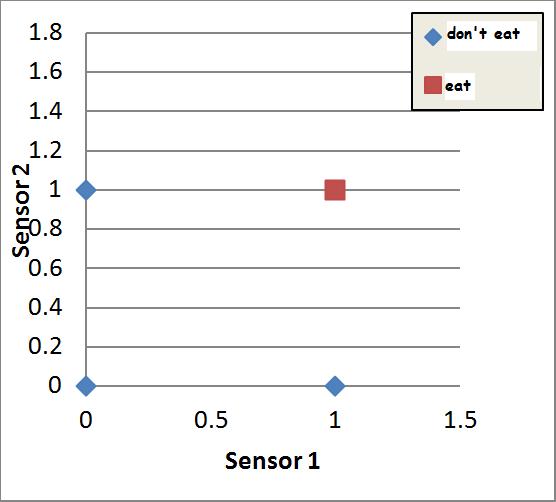
THE MATHS OF Miss successNow it's your turn to do this for Miss Success.
W1 = 0.5, W2 = 0.6, T = 1. After you have calculated two points on the line, you can copy the graph on the right onto paper and draw the line. |
|
Looking at the line you have drawn, can you say whether Grace is a successful Grak or not?
There is a lot more that we can do with this new mathematical model of a neural network and the visual aid of the graph. We have essentially imported hundreds of years of mathematical knowledge to help us.
Remember that we saw how changing the threshold could affect the success of the network? Well, now we can see on the graphs why this is.
First, have a guess. What do you think will happen to Miss Success's line if we increase T from 1 to 2? What about if we decrease it to a 0.5 or to a minus number?
There is also the question of what happens to the line if we change the values of the weights. What do you think will happen if we change just weight 1? Or just weight 2? Or both weights?
What will happen if we use non-binary input values? For example (0.9, 0.85) or (1.1, 0.7). This is an important question because it concerns a neural network’s ability to deal with fuzzy (unclear) or imperfect input data.
After you have thought about the questions above, see if you were correct by playing with the Excel spreadsheet called LINEAR SEPARABILITY.
|
| ||
concluding & playing
It is actually quite easy to predict what will happen with
this two input neuron when the weights and threshold are changed just by
looking at the mathematics.
By comparing the formula for a line with the formula for our artificial neuron, we worked out that the gradient of the neuron's line was: -W1 / W2 and the place where the line intercepts the stimulus 2 axis (the y-axis) was: T / W2 . Here are some facts we can gather from looking at these two little formulas:·
Going back to the Contrary neuron that I described (and you hopefully built) on the Making it Learn page, can you now see why the Contrary neuron was not able to learn the correct behaviour, while all three of the other neurons we built were?
By comparing the formula for a line with the formula for our artificial neuron, we worked out that the gradient of the neuron's line was: -W1 / W2 and the place where the line intercepts the stimulus 2 axis (the y-axis) was: T / W2 . Here are some facts we can gather from looking at these two little formulas:·
- The gradient of the line depends solely on the two weights.
- Because of the minus sign, if both weights have the same sign, the line will slope down. If just one of the weights is negative, it will slope up. [So what will happen if you find good positive values for the weights and threshold (eg; 0.5, 0.6, 1), then change all three to the equivalent negative values?]
- Changing just weight 1 will have an effect upon the steepness of the line, but not on where it intersects the stimulus 2 axis.
- Changing weight 2 will have an effect upon both the steepness of the line AND the place where it intersects the stimulus 2 axis.
- Because one is the numerator and the other the denominator, changing weight 1 will have the opposite effect upon the gradient to changing weight 2. [Set the weights and threshold to 0.5, 0.5, 0.8 respectively. Observe the gradient of the line. Now increase both weights to 0.6 and observe the gradient. Now to 0.7, etc. What do you notice?]
- The height of the line (the place where it cuts the stimulus 2 axis) is determined by the threshold and weight 2.
- Because the threshold is the numerator (the top half of the fraction), increasing it will push the line higher up the graph (it will make the place it cuts the stimulus 2 axis higher).
Going back to the Contrary neuron that I described (and you hopefully built) on the Making it Learn page, can you now see why the Contrary neuron was not able to learn the correct behaviour, while all three of the other neurons we built were?
|
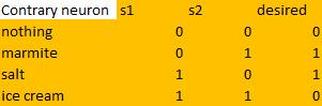
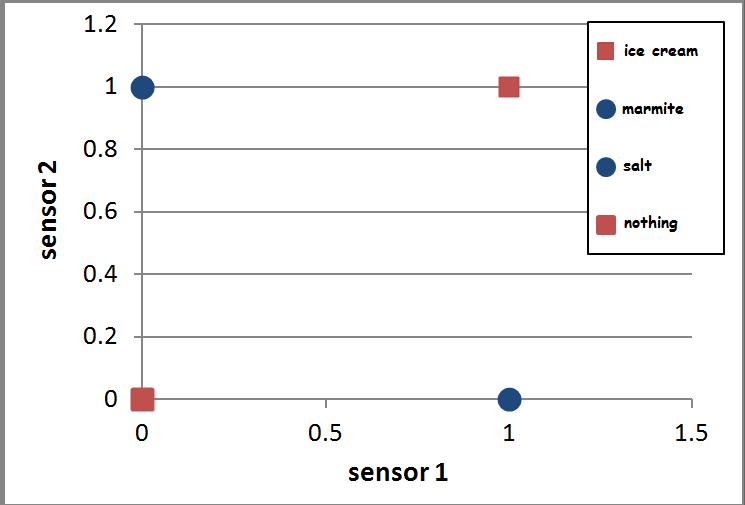
<-- The Contrary neuron has this logic table. <-- The logic table gives rise to this input space diagram. The blue circles are the foods the neuron wants to eat, while the red squares are the foods the neuron doesn't want to eat. Bearing in mind that a single neuron is able to divide the input space into two categories by drawing a single straight line through input space... ...can you see any way of drawing one straight line here so that the red squares are on one side and the blue circles on the other??? |
It's impossible!!!
There is no way to draw a single line though this input space so that the output=1 behaviours (marmite and salt) are on one side and the output=0 behaviours (ice cream and nothing) are on the other.
In the early days of Artificial Neural Network research, it was at this point that people lost faith/interest in them. If they couldn't solve a relatively easy problem like the XOR (the logic table of our Contrary neuron is the same as the XOR problem), then what use were they?
We'll start to see how this problem was overcome in the Neurons working together page.
Answers
* --> S1*W1 + S2*W2 >= T
** -->
Mr Fail neuron presented with marmite:
0 * 0.625 + 1 * 1.25 = 1.25. 1.25 is greater than the threshold (1), so the Mr Fail neuron fires when presented with the salt. This is an incorrect behaviour.
Mr Fail neuron presented with ice cream:
1 * 0.625 + 1 * 1.25 = 1.85. 1.85 is greater than the threshold, so the Mr Fail neuron fires when presented with ice cream, and in this case, this is the desired behaviour.
*** --> m = -W1/W2 c = T/W2
