Illusions in the retina
On this page I'm just going to use the model we made on the previous page, so if you haven't yet done that one, go back to the Visual System 1: Retina page and make that one.
Optical illusions do not all occur for the same reasons. They could be literal, physiological or cognitive illusions. See here for a nice description. The retina is a pre-cognitive area of the nervous system, and it is responsible for some of the physiological visual illusions, so that is what I'll be looking at here.
Optical illusions do not all occur for the same reasons. They could be literal, physiological or cognitive illusions. See here for a nice description. The retina is a pre-cognitive area of the nervous system, and it is responsible for some of the physiological visual illusions, so that is what I'll be looking at here.
Physiological illusionsA physiological illusion occurs because the machinery of the nervous system (the neurons) captures the light in a certain way. In other words, it's not because of judgement, expectation, or any other cognitive function, but instead has purely physical causes.
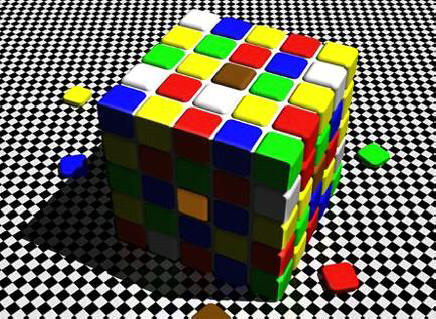
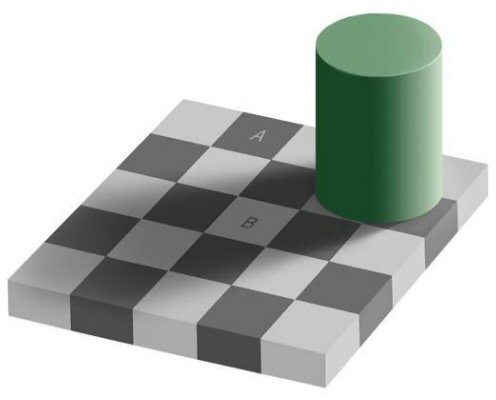
On the right are some examples of physiological visual illusions. The brown tile in the centre of the two faces of the colourful cube are exactly the same shade of brown. Stare at one point on the queen for a few seconds, then look at the centre of the white space. For just a moment you'll see the negative of the picture as a result of a sudden change in stimulation to your tired photoreceptors. Wikipedia has a good explanation of afterimages. This is the Herman grid illusion, and the first of the illusions we are going to be testing. Notice the little dark spots that seem to exist where the white lines cross. Also notice that if you focus on one of these intersections, the dark spot disappears. The second of the illusions we'll be testing is based on the phenomenon of Mach bands. The illusion on the right is an example of this. The two squares, A and B, are actually exactly the same shade, but because of the different shades of their respective surrounding squares, they appear completely different. There is a nice animation of this here. |


|
The hermann gridThe illusion of the dark dots occurs as a result of the centre-surround configuration of the bipolar cells. We made a model of this on the previous page, so open that up, or download it on the right (the one on the right has a colour coded light pattern which helps with understanding the picture).
To explain the phenomenon, let's consider two on-centre off-surround bipolar cells with centres lying on one of the vertical lines, as shown in the picture on the right. One of them lies between two black squares (upper cell), while the other is in the middle of a crossroad of white lines (lower cell). It's clear from the picture that the upper cell does not incur as much inhibition from light in its surround (remember that light in the centre excites the cell, while light in the surround inhibits it) as the lower cell does. The activation of a bipolar cell is the sum of its centre excitation and surround inhibition, thus the activation of the upper cell is greater than the activation of the lower one. As on-centre bipolar cell activation equates to the appearance of increased brightness, the weaker activation of the lower cell in the picture manifests itself as a dark spot in our vision. |
| ||
testing it
Let's jump right in and test it. It's very easy to do with the model we have. We just have to make appropriate light patterns. I've shown how this is done in the two pictures below.
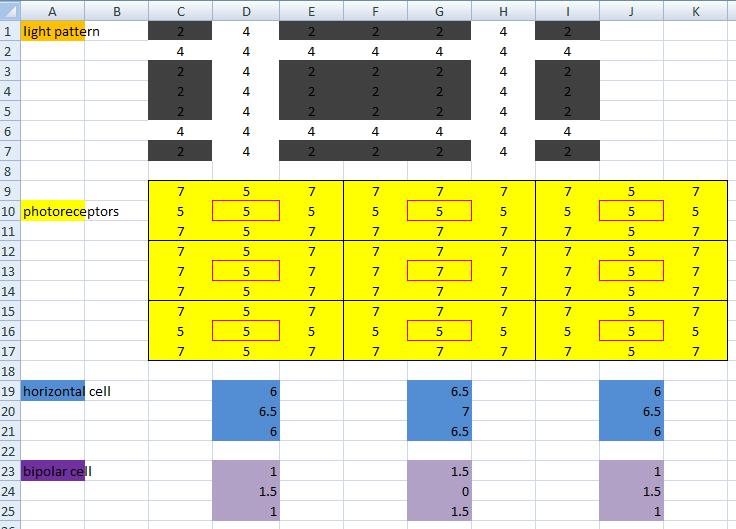
The bipolar cell we are looking at is the on-centre off-surround one in (Excel) cell E15. We can ignore the one next to it. The light pattern is the black and white 3x3 region at the top, and I've colour coded it so that higher numbers show up brighter than darker numbers.
The bipolar cell we are looking at is the on-centre off-surround one in (Excel) cell E15. We can ignore the one next to it. The light pattern is the black and white 3x3 region at the top, and I've colour coded it so that higher numbers show up brighter than darker numbers.
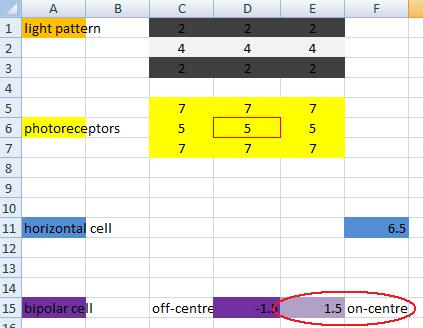
Here the centre of the bipolar cell's receptive field (cell D2) lies on a white line that is surrounded by two black regions. The only cells in the surround region of the receptive field that provide inhibition are cells C2 and E2. Take note of the bipolar cell's activation: 1.5.
|
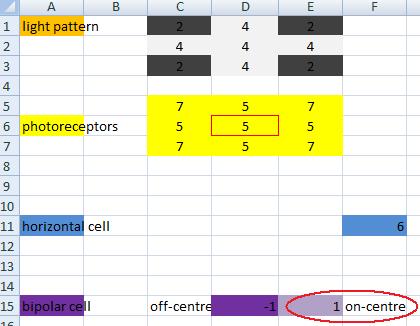
Here the centre of the bipolar cell's receptive field lies in the middle of a crossroads of white lines. Inhibition in the surround cells are provided by; D1, C2, E2 and D3 - twice the amount of inhibition as in the other case. This shows in the bipolar cell's activation: 1.
|
Remembering that bipolar cell activation equates to the perception of brightness, the case on the left will be perceived as brighter than the case on the right - 1.5 is greater, or brighter, than 1. It's as easy as that.
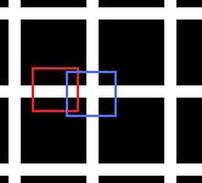
Now if you imagine that the two bipolar cells have adjacent receptive fields, so they are 'looking at' bits that are next to each other on the Hermann grid (as shown in the picture below), you can see why the area between the lines appear brighter than the area in the crossroads.
Now if you imagine that the two bipolar cells have adjacent receptive fields, so they are 'looking at' bits that are next to each other on the Hermann grid (as shown in the picture below), you can see why the area between the lines appear brighter than the area in the crossroads.
|
|
In order for the inhibition to occur in the surround of the receptive field, the receptive field must be big enough to cover a little bit of each of the surrounding dark areas of the Hermann grid. From this, we can predict that if the receptive field is too small, or the Hermann grid too large, the dark spots will not be perceived. In our eyes, the receptive fields of bipolar cells in our fovea (the centre of our vision) is smaller than that in our peripheral vision. This is why the dark spots disappear when we look directly at the centre of one of the crossroads. Below is a picture explaining this which I found on this site.
It would be simple to implement this in the Excel program. When looking directly at the crossroad (like B in the picture), the bipolar cells with receptive fields in the same position as B, and in the white paths directly surrounding it, would all be too small to hit the black areas on either side, so the light patterns would be uniform (all 4s, say). You can try this if you like, but any time all the cells in the light pattern are of the same value, the bipolar cell activation is zero.
|
If you want to test any of this out on a larger network, I've made one with a 3x3 grid of bipolar cells. The download is on the right, and a picture of the network is below.
I've removed the off-centre cells since we weren't looking at them, and I've set up the light pattern in a Hermann grid. Change that as you like. You should be looking at the activation of the purple bipolar cells. There is a one cell overlap in the receptive fields of each of the bipolar cells. You can check this for yourself by clicking on any of the bipolar cells, the using the 'Trace Precedents' function in the 'Formulas' tabbed menu. There's an example of this on the right. You can see the blue Trace Precedents dots in the light pattern showing the receptive field of the selected bipolar cell. |

| ||
mach bands
The next kind of illusion we'll investigate is the Mach bands style ones. The test we'll perform is equivalent to either of the two illusions I showed above and again here:
|
|
It's very easy to model, and we can use the same larger retina model that we've just been playing with. All we need to do is make a small square on the light pattern that has a constant brightness while all other cells are first darker, then lighter, and check the activation of the bipolar cell whose receptive field is most responsible for the constant square.
Below are the two light patterns that I used:
Below are the two light patterns that I used:
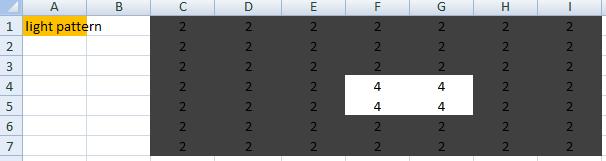
The 2x2 square is the area that will be held at a constant brightness of 4. This equates to the brown square on the coloured cube, or squares A and B in the other picture.
Here I chose an arbitrary value of 2 for all the darker surrounding areas. |
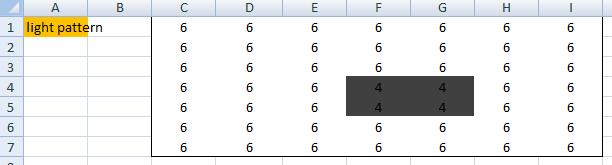
The 2x2 square still has the same value of 4, while the surrounding area has gone up to a brighter value of 6.
The change in the black/white shading is because I have used a relative colouring rather than an absolute one. It doesn't matter wrt the test, just for viewing convenience. |
If you put the square in the same place as I have (columns F~G, rows 4~5), then the bipolar cell you should be looking at is the one in cell G24. For the square to be perceived differently, the activation of the bipolar cell should be different in the two cases, despite the fact that the brightness of the square is the same in both cases. For the results to be in line with what we perceive when we look at the pictures, the bipolar cell should be less active in the case on the right than in the case on the left.
Links
So, that's an easy demonstration of the neural physics of why we experience two commonly known visual illusions. Here are a couple of papers where you can read more:
Visual Illusions and Neurobiology Exploring Sensory Neuroscience Through Experience and Experiment
and here is a powerpoint on the same topic:
Sensation & Perception PPT
Visual Illusions and Neurobiology Exploring Sensory Neuroscience Through Experience and Experiment
and here is a powerpoint on the same topic:
Sensation & Perception PPT
